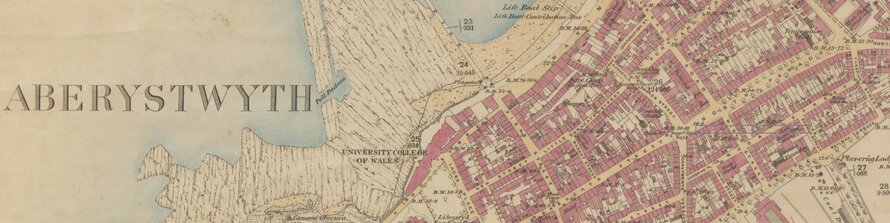
If you’ve ever wondered what once stood where your house is now — a chapel, a cowshed or perhaps a copper works — the 25-inch Ordnance Survey maps are one of the best places to look.
Introduced in the mid-19th century and surveyed across Wales mainly during the later 19th century, these maps show Wales in extraordinary detail: every building footprint, garden wall, hedge and footpath was recorded with surveyors’ precision. At a scale of 1:2,500 (or 25 inches to one mile), they were among the most detailed maps ever produced for the entire country — and they remain an unrivaled resource for researchers today.
The “Battle of the Scales” and the Birth of Detail
The 25-inch scale didn’t appear overnight. It was officially adopted in 1855 after a heated debate in Parliament and among surveyors — a dispute later dubbed the “Battle of the Scales.” The Ordnance Survey had experimented with several mapping scales, but 25 inches to the mile was chosen as the new “basic scale” for all cultivated rural areas across Britain.
This decision transformed national mapping. For the first time, it became possible to depict almost every man-made and natural feature in the landscape — from boundary stones and wells to greenhouses, paths and even bay windows. For much of rural Britain, no earlier mapping had captured the landscape with such intimacy and precision.
Towns with populations above 4,000 were mapped at an even larger scale of 1:500 (10.5 feet to the mile), while the 25-inch sheets covered everything, except for mountains and moorland.
What Are the 25-Inch Maps?
The Ordnance Survey’s 25-inch series was designed to map every county in Britain and Ireland at a consistent large scale. A full sheet normally covers about 1 mile by 1.5 miles – around one and a half square miles, meaning that thousands of individual maps were required to represent even Wales alone.
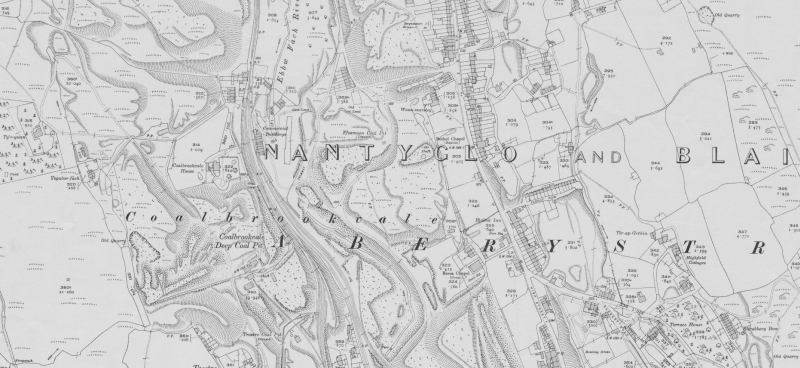
Surveyed mainly from the 1860s to the late 1880s, with later revised editions continuing into the 20th century, these maps record field boundaries, farm buildings, railway sidings, industrial yards, quarries, tramways and even individual trees in some areas. They also include subtle surveying symbols that give insight into land use and occupation — for instance, the small S-shaped brace linking separate parcels of land belonging to the same holding, or the parcel numbers that correspond to detailed entries in Parish Area Books (also known as Books of Reference).
The maps distinguish between types of woodland and open ground, with over ten different shading and texture symbols for features ranging from marshland to rough pasture. Interestingly, they show benchmarks and spot heights but not contour lines — those appeared only on the smaller-scale six-inch and one-inch series.
At this scale, Wales comes alive as a working landscape: industrial South Wales marked by collieries, tramroads and terraces; the rural west full of enclosed fields, chapels and winding lanes; and the north dotted with slate quarries and harbour towns.
A Window into Victorian Wales
The 25-inch series coincided with a period of dramatic change in Wales. The maps capture the height of industrial expansion — the spread of railways, the growth of coal and slate mining, and the transformation of small market towns into bustling centres of trade and production.
But they also record the quieter details of everyday life: the chapels and churches that anchored communities, the wells and smithies that served them, and the schools that appeared on the edges of villages. Each sheet feels like a snapshot of life frozen in ink.
It’s this balance — industrial and domestic, grand and ordinary — that makes the 25-inch maps such a valuable tool for family historians, archaeologists, planners and anyone curious about how their area has changed.
The National Library’s Collection
The National Library of Wales holds one of the most comprehensive collections of 25-inch Ordnance Survey maps for Wales and maintains significant holdings of English, Scottish and Irish equivalents. These maps are available for consultation in the Library’s Reading Room and have long been among our most frequently requested cartographic materials.
They are not only beautiful examples of mapmaking, but essential for tracing how landscapes have evolved — from field patterns and parish boundaries to the growth of towns, ports and mines across Britain and Ireland.
In addition to the standard published sheets, the Library’s collection includes final drawings made to show revisions for later editions, from which the printing plates were created and produced for later editions (often referred to as the “blue and black drawings”). These preparatory sheets illustrate the meticulous revision process behind each new edition, showing new railways, housing developments, boundary changes and new industrial sites.
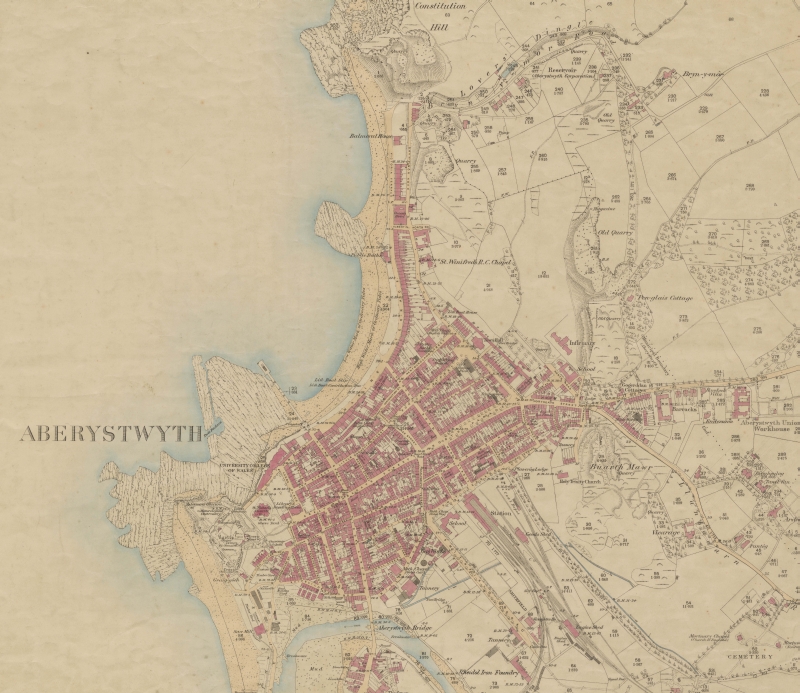
Some of the earliest sheets were hand-coloured, using blue for water, burnt sienna for roads, and delicate tones of carmine and grey to distinguish between brick, stone or iron-clad buildings. The maps were printed using zincography — a form of lithography far cheaper and easier to correct than the copper engraving used for smaller scales.
Their bold linework and large lettering were deliberately designed to be photographically reduced to create the six-inch series — saving time and ensuring consistency across the national mapping programme.
Digitising Wales, One Sheet at a Time
We have recently undertaken a major project to digitise the First Edition 25-inch maps of Wales, covering the thirteen historic Welsh counties. These were the first large-scale maps to capture the entire country in consistent detail, and they form one of the cornerstones of the National Map Collection.
The 25-inch maps are among the most in-demand items in our collection but, until now, have only been available to view onsite. Once digitised, they will be freely accessible online for the first time, greatly increasing their visibility and use — not only among regular readers but also educators, local historians and community heritage groups.
The project also builds upon the Library’s earlier work to digitise the large-scale Ordnance Survey town plans, which share the same format and sheet size. Working with the Royal Commission on the Ancient and Historical Monuments of Wales, the newly digitised maps are being georeferenced and displayed online, allowing users to explore them interactively and view Wales as it appeared over a century ago.
Digitisation also helps protect the fragile originals. The size and age of these sheets mean that many are difficult to handle, and some have suffered damage over time. These maps are now undergoing careful encapsulation to help protect them from further deterioration. Creating high-resolution digital versions will further ensure long-term preservation while making access far easier for all.
When complete, the project will provide a seamless, map-based search interface, allowing users to locate places across Wales with a single click rather than navigating hundreds of paper sheets manually.
Why They Still Matter
Although the 25-inch maps were originally created for administrative purposes, they now serve a much wider audience. Genealogists use them to locate family homes mentioned in census returns; environmental researchers study them to understand historical land use; and local historians use them to trace the growth — and sometimes disappearance — of settlements.
Each sheet reveals the extraordinary care of the Ordnance Survey’s surveyors — right down to garden boundaries, pump wells and even the outlines of greenhouses and glassworks. For modern researchers, they remain one of the most intimate portraits of the British landscape ever produced.
Remarkably, the same 1:2,500 scale introduced over 160 years ago is still used as a basic scale for some of today’s Ordnance Survey digital mapping — proof of the enduring legacy of those original surveyors and their meticulous craft.
Most importantly, these maps remind us that the modern landscape — with its retail parks, bypasses and housing estates — rests on the layered geography of the past.
Discover More
The First Edition 25-inch maps will be made available through the Library’s website once the digitisation project is complete.
For now, visitors can view the physical maps in the Library’s reading room and explore how Wales — and indeed Britain and Ireland — were measured, mapped and meticulously drawn, one field at a time.
By Rhodri Evans, Senior Curatorial Assistant (Maps), National Library of Wales
Further Reading
For readers interested in learning more about the history and development of Ordnance Survey mapping, the following publications provide an excellent introduction:
Oliver, Richard. Ordnance Survey Maps: A Concise Guide for Historians. 3rd ed. London: The Charles Close Society, 2013.
Oliver, Richard, and Roger Hellyer. Ordnance Survey of Great Britain: England and Wales: Indexes to the 1/2500 and Six-inch Scale Maps. Kerry: David Archer, 2002.
Seymour, W. A. (ed.). A History of the Ordnance Survey. Folkestone: Dawson, 1980.
Owen, Tim, and Elaine Pilbeam. Ordnance Survey: Map Makers to Britain Since 1791. Southampton: Ordnance Survey, 1992.
Category: Article